At a glance: In 2026, the median owner-occupied home value is $248,900 in the City of Savannah and $302,700 in Chatham County (U.S. Census Bureau, 2020 to 2024). Actual sale prices range from the high $200Ks in metro corridors such as Pooler and Rincon to $1M+ in the Historic District and on Tybee Island. Block, condition, and flood zone move value as much as the neighborhood name, so a current CMA on MLS data is the most accurate next step.
By Alex Rodino, Founder, Alexander Rodino Collective | Serving Savannah & Coastal Georgia. Last updated June 2026.
The information in this guide is general market data, not a valuation of your specific home. Price data reflects a trailing 90-day window as of April 2026 and can change.
For a property-specific valuation, request ARC’s free Home Value + Selling Plan.
TL;DR: Savannah Home Values in 2026
Short answer: In April 2026, the median owner-occupied home value is $248,900 in the City of Savannah and $302,700 in Chatham County (U.S. Census Bureau, 2020–2024). Actual sale prices vary widely by neighborhood, from the high $200Ks in metro corridors to $1M+ in the Historic District and on Tybee Island. The breakdown below shows current 2026 pricing block by block.
Savannah home values are still highly neighborhood-specific in 2026. Census data shows Savannah city’s median owner-occupied home value at $248,900 for 2020 to 2024, while Chatham County’s median owner-occupied value is $302,700. These are broad public benchmarks, not current MLS sale-price medians. (U.S. Census Bureau)
In-town Savannah pricing depends heavily on architecture, condition, off-street parking, block quality, historic character, and renovation level. Two homes five blocks apart can produce very different buyer demand.
Islands and waterfront areas usually price around lifestyle, lot, water proximity, flood insurance profile, and condition. Census reports Wilmington Island’s median owner-occupied value at $404,900 and Skidaway Island’s at $803,700 for 2020 to 2024, which shows the broad premium for established island areas. (U.S. Census Bureau)
Metro suburbs and growth corridors such as Pooler, Richmond Hill, and Rincon are driven by schools, commute, newer construction, HOA amenities, and buyer payment sensitivity. Pooler’s Census median owner-occupied value is $322,400, Richmond Hill’s is $313,400, and Rincon’s is $251,600. (U.S. Census Bureau)
Sell now vs. wait: if your equity, next-step plan, home condition, and neighborhood inventory are aligned, 2026 can still be a strong selling window. If not, build a 3 to 6 month prep plan.
The five factors that move your home’s value most are location within the neighborhood, condition, flood and insurance profile, major systems age, and the quality of recent comparable sales.
For a personalized number, request ARC’s free Home Value + Selling Plan.
Key Savannah housing stats (April 2026)
- FHFA Savannah MSA House Price Index: 461.88 (Q4 2025), up from 445.67 (Q4 2024)
- 30-year fixed mortgage rate: 6.23% (Freddie Mac PMMS, April 23, 2026)
- Median owner-occupied home value, City of Savannah: $248,900 (U.S. Census, 2020–2024)
- Median owner-occupied home value, Chatham County: $302,700
- Skidaway Island median: $803,700 | Wilmington Island: $404,900 | Pooler: $322,400 | Richmond Hill: $313,400 | Rincon: $251,600
Table of Contents
- The Savannah Home Value Snapshot: Where Prices Stand in 2026
- Why Zillow and Redfin Estimates Miss the Mark in Savannah
- Savannah Home Values by Neighborhood in 2026
- The 7 Factors That Actually Move Your Home’s Value in Savannah
- How a Real CMA Differs from a Zestimate
- Savannah Market Trends: Is It a Seller’s or Buyer’s Market Right Now?
- Should You Sell Now or Wait? A 6-Question Decision Framework
- Seasonality: When Is the Best Time to Sell a Savannah Home?
- High-ROI Prep Work: What’s Worth Doing Before You List
- Net Proceeds: What You Actually Take Home
- How ARC Builds a Home Value + Selling Plan
- Frequently Asked Questions
The Savannah Home Value Snapshot: Where Prices Stand in 2026
Short answer: Savannah home values in 2026 sit around $248,900 (city median, owner-occupied) and $302,700 (Chatham County), but actual sale prices range from the high $200Ks in metro corridors to $1M+ in the Historic District and waterfront islands. Block, condition, and flood zone matter as much as ZIP code.
Savannah home values in 2026 are best understood as a layered market: public value benchmarks show long-term growth, while MLS sale data is required for a precise current pricing answer. The Federal Housing Finance Agency’s Savannah MSA House Price Index was 461.88 in Q4 2025, up from 445.67 in Q4 2024. Chatham County’s annual FHFA House Price Index reached 324.82 in 2025, up from 317.51 in 2024. (FRED, Federal Reserve Bank of St. Louis)
That means the broad Savannah-area value trend remained positive entering 2026. It does not mean every home, block, or neighborhood rose by the same amount. FHFA explains that its House Price Index measures changes in single-family home values across broad markets, not the specific sale value of one address. (Federal Housing Finance Agency)
For a seller, the practical takeaway is simple. Savannah behaves more like a dozen connected micro-markets than one. Buyer demand on Bull Street, in Pooler, and on Wilmington Island responds to entirely different forces. A renovated Ardsley Park home, a historic row house downtown, a Wilmington Island ranch, a Pooler new-construction resale, and a Tybee Island short-term rental candidate all need different pricing logic.
Mortgage rates also matter. The Freddie Mac 30-year fixed mortgage average was 6.23% on April 23, 2026, down from 6.46% on April 2, 2026. Rate movement affects buyer payment tolerance, especially in suburbs and move-up price ranges. (Freddie Mac PMMS, via FRED)
Seller meaning: pricing still matters. Strong homes priced correctly continue to sell at full value. Overpriced homes sit until they reduce. Buyers are still active across most segments, but they are noticeably more payment-sensitive than they were during the lowest-rate years.
For month-to-month context on prices and inventory, you can also cross-reference the Redfin Savannah housing market data, though local MLS comps remain the most accurate basis for pricing a specific home.
Why Zillow and Redfin Estimates Miss the Mark in Savannah
Short answer: No. Zillow Zestimates and Redfin estimates are directionally useful but routinely off in Savannah because their algorithms cannot read flood zones, off-street parking, historic-district designations, or interior renovation quality; the variables that actually move price here.
Automated valuations can be useful starting points, but they are not a Savannah pricing strategy.
How Automated Valuations Work and Where They Fail
Automated valuation models, often called AVMs, estimate value using public records, historical sales, property characteristics, tax data, and nearby comparable sales. The problem is that AVMs cannot walk the house, smell moisture in a crawlspace, judge the quality of a renovation, or understand why one side of a block sells better than another. Public records and tax data only carry a valuation so far before local context takes over.
That matters in Savannah.
Why Savannah Is Especially Hard for AVMs
Savannah has historic housing stock, uneven renovation quality, flood-zone variation, block-by-block character, off-street parking premiums, short-term rental considerations, and older systems behind attractive facades.
In the Historic District, Victorian District, Starland, Thomas Square, and Ardsley Park, the difference between “updated” and “properly restored” can be large. On the islands, value can change based on elevation, insurance, water proximity, lot shape, marsh view, dock access, and roof age. In Pooler or Richmond Hill, value may depend on builder, subdivision, lot position, school path, HOA amenities, and buyer competition.
When a Zestimate Is Close to Accurate
An AVM is more likely to be close when the home is in a large subdivision with similar floor plans, recent nearby sales, and few unusual features. It is more likely to miss when the home is historic, custom, waterfront, heavily renovated, under-renovated, tenant-occupied, in a low-volume neighborhood, or affected by flood and insurance questions.
A more useful approach is to treat the AVM as a starting question that needs a real answer, not a final figure.
ARC insight: The most common Savannah valuation surprise is not that Zillow is always too high or always too low. It is that the estimate misses the reason buyers care. Parking, roof age, flood zone, floor plan, porch quality, street feel, and renovation style can all change the number faster than an algorithm catches.
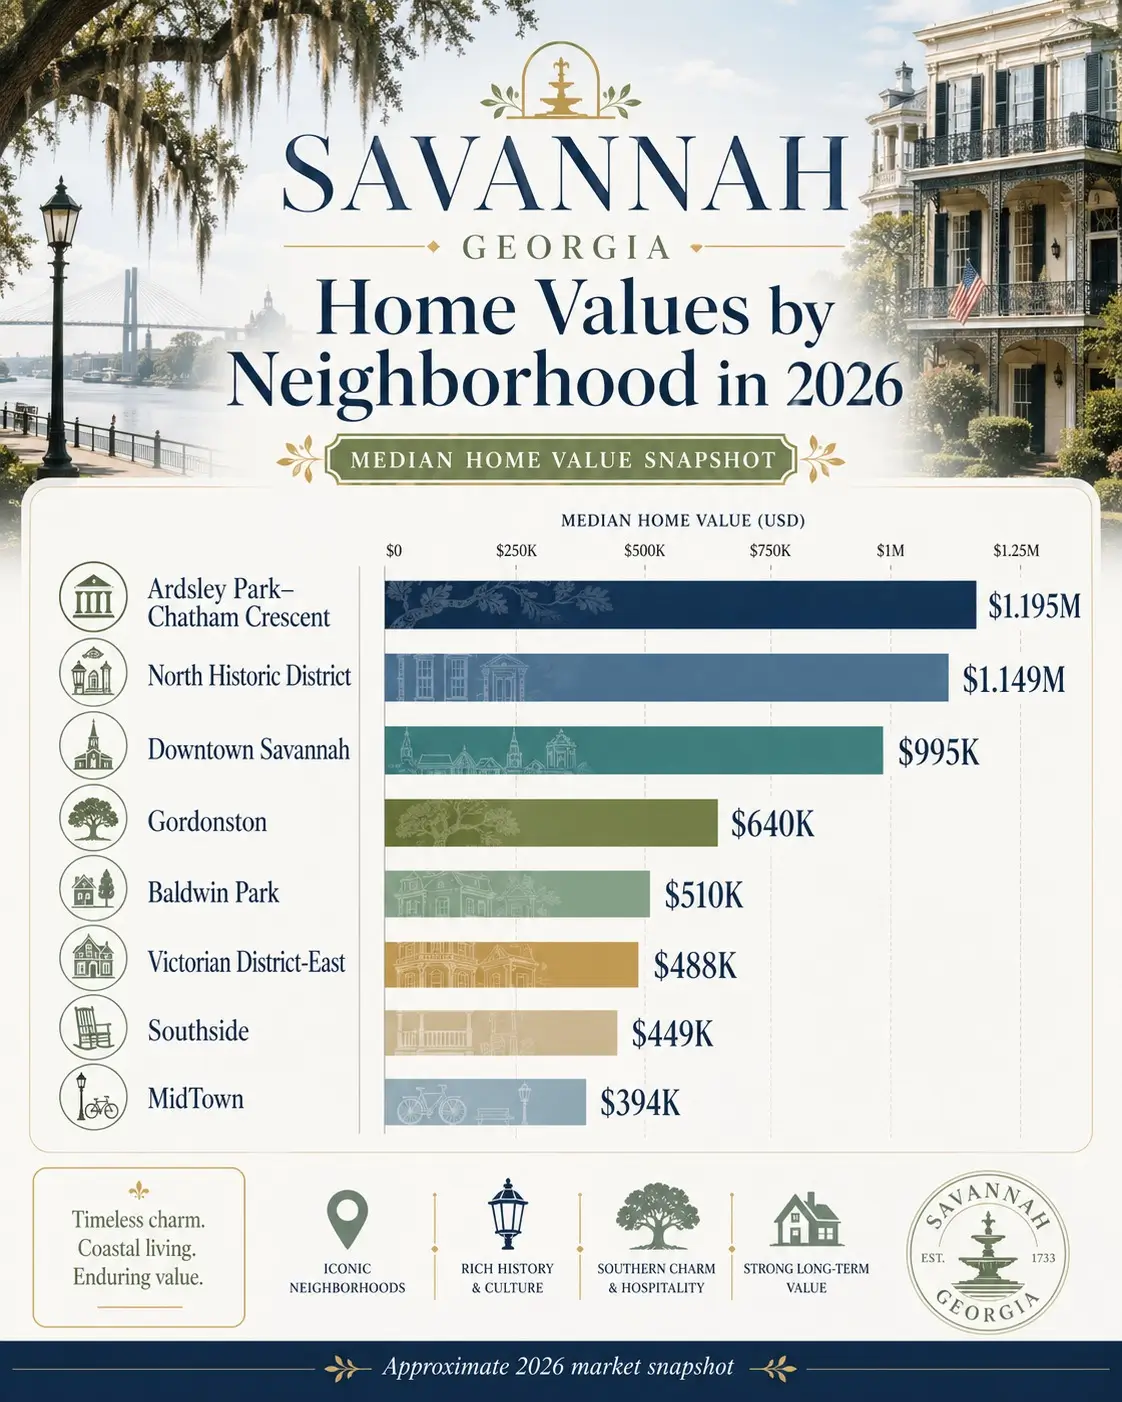
Savannah Home Values by Neighborhood in 2026
Short answer: Savannah pricing is hyperlocal: in 2026 the same square footage can sell for 2–3x different prices depending on whether it is in Ardsley Park, Pooler, Tybee Island, or a transitional in-town block. Neighborhood-by-neighborhood pricing is below.
Savannah pricing is hyperlocal. The same square footage can sell very differently based on block, renovation level, flood risk, parking, porch condition, rental potential, school path, and buyer lifestyle fit. The sections below break down what drives value in each market segment, with links to neighborhood pages for current listings and local detail.
In-Town and Historic Savannah
In-town Savannah neighborhoods are driven by architectural scarcity, walkability, renovation quality, parking, tree canopy, and block-by-block buyer perception. Two homes a few blocks apart can price very differently based on porch condition, off-street parking, alley access, and the quality of nearby renovations. Square footage and bedroom count carry less weight in-town than in the suburbs, where authenticity, condition, and exact location within the neighborhood often drive the larger share of value.
The premium tier inside the historic core sits in the Historic District, Ardsley Park / Chatham Crescent, and the Victorian District. Buyers in these pockets pay for preserved architecture, mature trees, walkability to squares and parks, and the kind of streetscape that does not exist in newer construction. A restored row house downtown, a center-hall home in Ardsley, or a well-kept Victorian on a clean block can each command a meaningful premium over similar square footage outside the historic core.
The character and creative tier includes the Starland District, Thomas Square, and Baldwin Park. These neighborhoods reward thoughtful renovation, design-forward updates, and proximity to local cafés, galleries, and walkable corridors. Buyer demand here is less about square footage and more about whether the home feels current, livable, and connected to the neighborhood’s energy.
Family-oriented in-town options include Daffin Park / Parkside, Gordonston, and Midtown Savannah. These pockets blend in-town convenience with quieter residential streets, more usable yards, and easier parking. They tend to draw buyers who want the Savannah lifestyle without the trade-offs that come with living inside the historic core.
The most useful pricing question for any in-town seller is not “what is my neighborhood worth,” but “what would a buyer pay for a home like mine, on a block like mine, in this exact condition, this month.” That answer changes faster than public data can track, and Zillow or Redfin estimates routinely miss the block-level details that move in-town value most.
For a current pricing answer specific to your block, condition, and recent comparable sales, request ARC’s free Home Value + Selling Plan.
Islands and Waterfront
Island and waterfront values in the Savannah area are driven by lot, view, elevation, insurance profile, roof condition, dock or water access, and lifestyle demand. Two waterfront homes on the same island can price very differently based on marsh view, elevation, flood zone designation, and how recently the roof has been updated. Insurance cost is a meaningful part of the buyer’s monthly payment math, and homes with manageable premiums often see broader buyer demand than otherwise comparable homes with high insurance loads.
Census data offers a useful directional benchmark for the broad price gap between island markets. Wilmington Island’s median owner-occupied home value was $404,900 for 2020 to 2024, while Skidaway Island’s was $803,700 for the same period. Those figures help illustrate the difference between established suburban island housing and higher-end planned or gated island inventory, but they are not current closed-sale medians and should not be used as a list-price reference. (U.S. Census Bureau)
The established island tier includes Wilmington Island, Whitemarsh Island, and Talahi Island. These communities offer a balanced trade-off: coastal proximity, mature neighborhoods, reasonable commute access to downtown, and a wider price range than the gated alternatives. Buyer demand here usually centers on lot quality, condition, and how the home handles the realities of coastal ownership.
The amenity and gated tier includes Skidaway Island and The Landings, Dutch Island, and Burnside Island. Buyers in these pockets often pay for community amenities, controlled access, golf or marina infrastructure, and a more enclosed neighborhood setting. Pricing is highly property-specific. View, elevation, dock access, and recent renovation level can produce wide value differences between homes inside the same community.
Tybee Island sits in its own category. As the area’s true beach market, Tybee values are influenced by short-term rental potential, distance to the beach, parking, and the seasonal rental income story behind each home. A Tybee home that performs well as a vacation rental may command pricing that does not map cleanly to comparable square footage on Wilmington or Whitemarsh.
For waterfront and high-elevation properties especially, accurate pricing requires walking the lot. Public data cannot see roof age, dock condition, marsh view obstruction, flood vent compliance, or the small factors that move island values.
For a property-specific island or waterfront valuation that accounts for view, elevation, insurance profile, and recent comparable sales, request ARC’s free Home Value + Selling Plan.
Metro and Growth Corridors
Metro and growth-corridor values around Savannah are driven by schools, commute, newer construction, HOA amenities, builder competition, and buyer payment sensitivity. Suburban buyers tend to be more rate-sensitive than in-town or waterfront buyers because the price-to-payment math is what determines whether a home fits their qualification range. When mortgage rates move, suburban demand and pricing move with them more visibly than premium in-town inventory.
Public Census benchmarks show the broad value spread across the major suburbs. Pooler’s median owner-occupied value is $322,400, Richmond Hill’s is $313,400, and Rincon’s is $251,600 for 2020 to 2024. These figures are not current closed-sale medians, but they help frame the affordability difference between the three suburbs. (U.S. Census Bureau)
Pooler and Godley Station sit in the area’s most active growth corridor, with a steady supply of newer construction, planned communities, and easy access to I-95, I-16, and the airport. Resale homes in Pooler often compete directly with new construction down the street, which means presentation, condition, and pricing discipline matter more here than in tighter inventory markets. Builders running incentives can pull buyers away from resale unless the resale home is priced and shown well.
Richmond Hill draws a different buyer pool. Bryan County schools, a more residential pace, and the southern commute corridor toward Hinesville and Fort Stewart shape demand. Service members and families managing a PCS can start with ARC’s Coastal Georgia military relocation help. Buyers comparing Pooler and Richmond Hill are usually weighing school path, commute direction, and lifestyle preference rather than chasing the lowest price.
Rincon and the Effingham County corridor often appeal to buyers prioritizing affordability, larger lots, and a quieter pace. Inventory turnover, school zoning, and commute distance to Savannah employment centers shape pricing more than in-town factors.
Inside Chatham County, Southside Savannah, Coffee Bluff, and Georgetown offer convenience-first suburban living closer to the city core. These pockets tend to draw value-conscious buyers who want established neighborhoods, broader inventory variety, and shorter routes to downtown employment, hospitals, and shopping.
For a suburb-by-suburb buyer comparison covering schools, commute, lifestyle, and price, see ARC’s Pooler vs. Richmond Hill vs. Rincon comparison.
For a current valuation of your suburban or metro home that accounts for new-construction competition, school path, and recent neighborhood sales, request ARC’s free Home Value + Selling Plan.
The 7 Factors That Actually Move Your Home's Value in Savannah
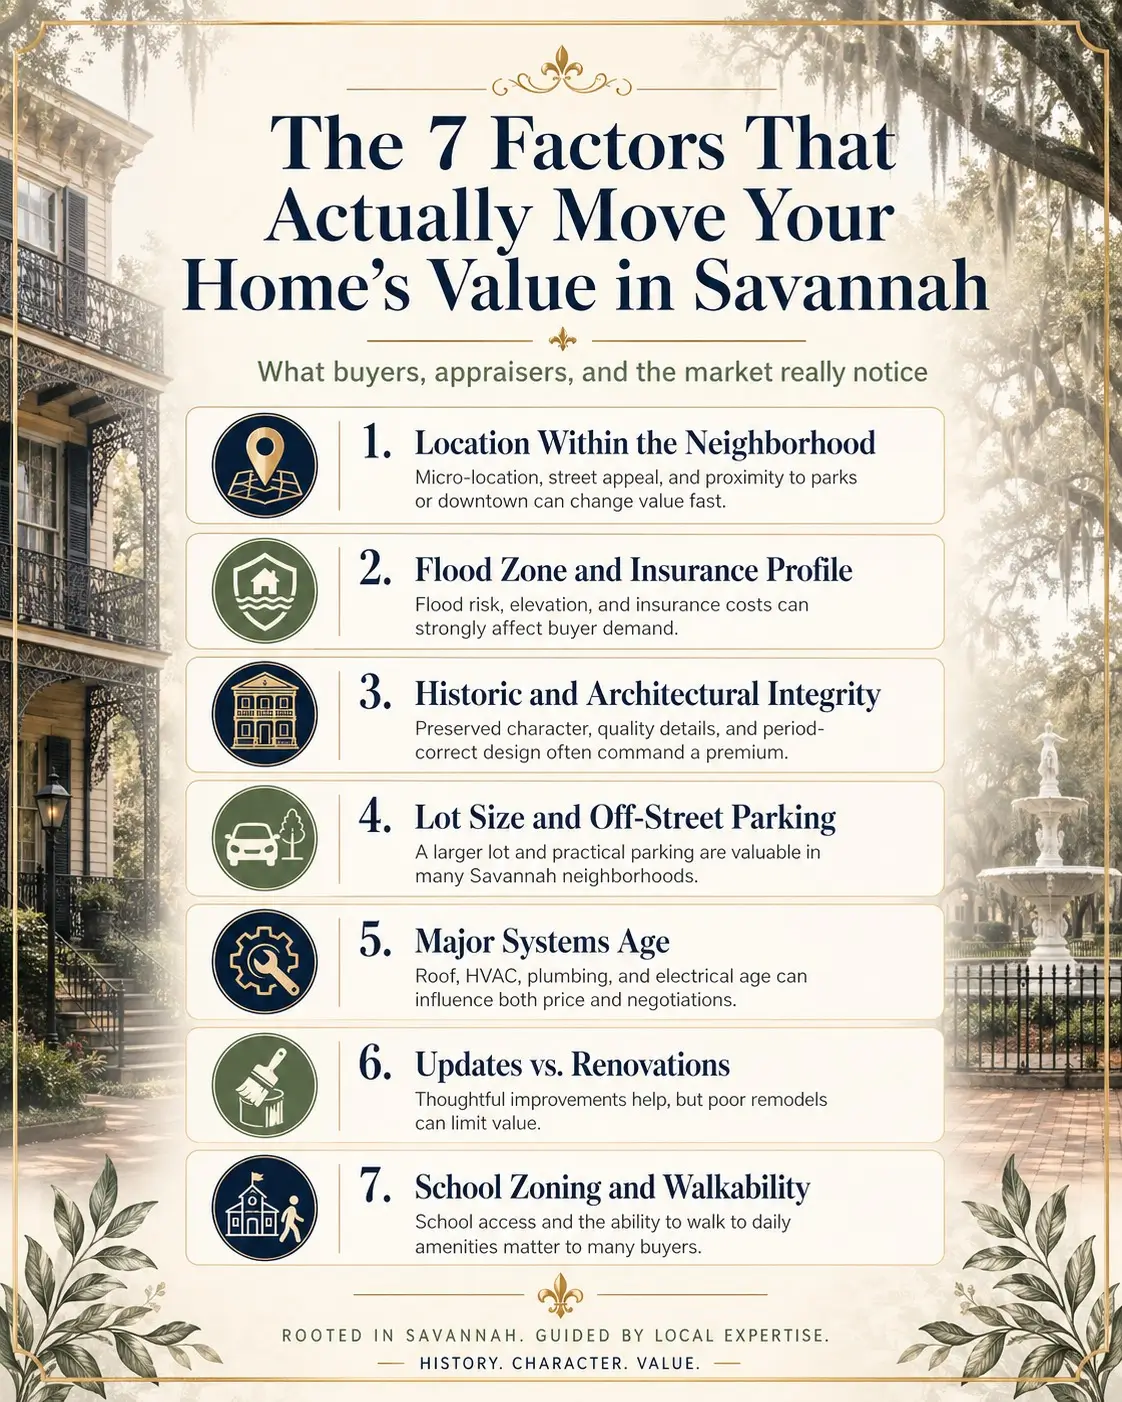
Short answer: The seven factors that move Savannah home value the most in 2026 are location within the neighborhood, flood zone, historic and architectural integrity, lot size and off-street parking, age of major systems, updates vs. full renovations, and school zoning and walkability.
Savannah home values are shaped by more than square footage and bedroom count.
1. Location Within the Neighborhood
The neighborhood name gets a buyer to schedule the showing, but the specific block usually decides whether they write the offer. Noise, traffic, tree canopy, view, walkability, corner-lot position, alley access, and neighboring property condition all matter.
In Savannah, a stronger block can outperform a larger house nearby. That is especially true in historic and in-town neighborhoods.
2. Flood Zone and Insurance Profile
Flood zone and insurance costs can change both buyer demand and net value. A home with a manageable insurance profile may attract a larger buyer pool. A home with high flood premiums, roof concerns, or uncertain coverage may face more scrutiny.
FEMA’s Map Service Center is the public source buyers and sellers use to review flood maps by address. For a deeper breakdown, read ARC’s guide on how flood zones affect Savannah home values.
3. Historic and Architectural Integrity
Historic District, Victorian District, Ardsley Park, Baldwin Park, Parkside, and Gordonston buyers often pay attention to details. Original floors, windows, trim, fireplaces, porches, ceiling height, and facade integrity can all affect perceived value.
Not every old feature is valuable. The value comes from condition, quality, consistency, and how well the home lives today.
4. Lot Size and Off-Street Parking
Off-street parking can move value in in-town Savannah. Lot width, usable yard, guest parking, alley access, and garage potential can all affect buyer demand.
On the islands, lot value can also reflect marsh view, privacy, elevation, water access, dock potential, and tree coverage.
5. Major Systems Age
Buyers inspect roofs, HVAC, electrical, plumbing, foundation, windows, drainage, and moisture. Cosmetic upgrades rarely overcome systems problems. A renovated kitchen does not offset an aging roof, and a refreshed bathroom does not resolve knob-and-tube wiring or crawlspace moisture for a buyer reading the inspection report.
System age affects value because it affects confidence.
6. Updates vs. Renovations
Not all updates create value. Paint, lighting, hardware, landscaping, minor repairs, and deep cleaning often help. Overly personal finishes, partial renovations, or expensive projects done without buyer demand can miss the mark.
The goal is not perfection. It is removing the objections a buyer would otherwise use to negotiate the price down or walk away.
7. School Zoning and Walkability
In suburban markets, school path and commute often matter most. In in-town areas, walkability and neighborhood lifestyle can carry more weight. For sellers, this means the same home may appeal to different buyer pools depending on location.
ARC insight: Sellers often ask, “What should I fix?” The better question is, “What will buyers use against the price?” In Savannah, that usually means roof, moisture, HVAC, paint, smell, clutter, parking, and insurance questions before expensive design upgrades.
How a Real CMA Differs from a Zestimate
Short answer: A real CMA is a Realtor-prepared analysis that compares your home to recent sales of similar properties using current MLS data and human adjustments; a Zestimate is an algorithm that cannot see your interior, flood zone, or block. CMAs are typically accurate within 2–5%; Zestimates often miss by 5–15% in Savannah.
A real CMA is a pricing analysis built around the specific home, not just public data.
What a Comparative Market Analysis Includes
A comparative market analysis, or CMA, looks at recent closed sales, active competition, pending listings when available, expired listings, property condition, improvements, lot, location, buyer pool, and current market direction.
A strong CMA does not just ask, “What sold nearby?” It asks, “Which homes would a buyer choose instead of yours, and what did buyers actually pay for similar tradeoffs?”
How a CMA Handles Adjustments
A CMA adjusts for condition, parking, renovation quality, lot size, flood profile, school path, location within the neighborhood, and market timing. It also accounts for whether the comparable sale was truly comparable.
That is where Savannah pricing needs human judgment.
CMA vs. Appraisal vs. AVM
Factor | AVM (e.g., Zestimate) | CMA, Agent-Prepared | Appraisal, Licensed |
Who creates it | Algorithm | Real estate advisor | Licensed appraiser |
Cost | Usually free online | Often free from agent | Paid, usually ordered for lending or legal use |
Accuracy range | Varies widely | Strong when comps and judgment are good | Formal opinion under appraisal standards |
Best used for | Starting point | Pricing and listing strategy | Lending, estate, legal, or formal valuation needs |
Recognized by lenders | No | No | Yes, when ordered through proper lending process |
For most sellers, the best first step is a CMA. If the situation involves estate, divorce, legal dispute, tax planning, or lending, an appraisal may also be appropriate.
Savannah Market Trends: Is It a Seller's or Buyer's Market Right Now?

Short answer: In April 2026, Savannah is best described as a balanced market with seller-favored pockets. Months of inventory, days on market, and list-to-sale ratio all vary by neighborhood and price band; some segments still favor sellers, others have shifted toward buyers.
Savannah’s 2026 market is neither one simple seller’s market nor one simple buyer’s market.
The broad price trend remains positive based on FHFA index data, but buyer behavior is more selective because financing costs are still meaningful. The Savannah MSA FHFA House Price Index rose from Q4 2024 to Q4 2025, while the 30-year fixed mortgage rate sat above 6% in late April 2026. (FRED, Federal Reserve Bank of St. Louis)
Current Months of Inventory
Months of inventory measures how long the current supply of listed homes would last at the current sales pace. Lower months-of-inventory readings typically support sellers, while higher readings give buyers more leverage to negotiate. The headline figure for the entire Savannah metro can mislead, though, because inventory varies sharply by price range, neighborhood, and property type. A balanced metro number can hide a tight in-town historic market or a softer suburban segment with new-construction pressure.
The number that matters for any individual seller is the months of inventory in their specific price range and neighborhood. ARC’s Home Value + Selling Plan includes a current inventory snapshot for your segment, pulled from the most recent 90-day MLS data.
Days on Market and List-to-Sale Ratio
Days on market shows how long homes typically take to go under contract. List-to-sale ratio shows how close the final sale price is to the original or final list price. Together, these two numbers tell a seller whether pricing power is strong, balanced, or soft in their segment.
City-wide averages can mislead because well-priced homes in strong condition often sell quickly, while overpriced or under-prepared homes can sit for months. The number that matters is the median DOM and list-to-sale ratio for homes comparable to yours, in your neighborhood, in the most recent 90-day window. ARC pulls those figures as part of every Home Value + Selling Plan.
How the Market Has Shifted Over the Last 24 Months
Sellers still have opportunities in 2026, but the margin for overpricing has narrowed. Buyers are running monthly payment math against condition, insurance load, and alternative listings before they make an offer. Well-prepared homes priced to current comps continue to perform, while homes needing work but priced as if renovated tend to sit on the market.
Where the Market Is Tighter and Softer
Segment | Current Temperature | Rationale |
In-Town Savannah | Balanced to seller-leaning | Scarcity, architecture, and walkability support strong listings, but condition still matters. |
Islands | Mixed | Lifestyle demand is strong, but insurance, flood, roof, and price point can narrow the buyer pool. |
Metro Suburbs | Balanced | New construction and resale compete directly, especially when rates affect payment. |
Waterfront | Property-specific | View, dock access, elevation, insurance, and condition can produce large value differences. |
Should You Sell Now or Wait? A 6-Question Decision Framework
Short answer: The right time to sell depends on six things: your equity position, your next destination, how show-ready your home is, your neighborhood’s inventory, rate sensitivity in your buyer pool, and the cost of waiting. The framework below walks through each.
The right time to sell depends on more than market conditions. Equity position, timeline, property readiness, and the clarity of your next move all shape whether the current window works for you.
1. Is Your Equity Position Where You Need It to Be?
Start with net proceeds, not sale price. Your useful number is expected sale price minus mortgage payoff, seller costs, repairs, concessions, taxes, and moving expenses.
2. Do You Have a Clear “Where to Next”?
A strong sale matters less if your next step is unclear. Before listing, know whether you are buying, renting, downsizing, relocating, or holding proceeds.
3. Is Your Home Ready to Show?
If the home needs only light prep, listing soon may make sense. If it needs clean-out, roof work, paint, landscaping, or repairs, a 3 to 6 month plan may produce a better result.
4. Does Your Neighborhood’s Inventory Favor Sellers?
If nearby inventory is low and recent comps are strong, the current window may be favorable. If your neighborhood has competing listings or new construction pressure, pricing strategy becomes more important.
5. Is Rate Sensitivity Driving Your Buyer Pool?
Higher rates affect entry-level, move-up, and suburban buyers differently. If your likely buyer is payment-sensitive, pricing and concessions may matter more than headline value.
6. What Is the Cost of Waiting?
Waiting has costs: mortgage, taxes, insurance, maintenance, HOA, repairs, vacancy risk, and market uncertainty. Appreciation must beat those costs to make waiting worthwhile.
Decision matrix: If you answered yes to 4 or more questions, listing now may be worth exploring. If you answered yes to 1 to 3, build a 3 to 6 month selling plan. If none are aligned, revisit in 6 months.
Seasonality: When Is the Best Time to Sell a Savannah Home?
Short answer: The best time to sell a Savannah home is usually February through May, when buyer activity peaks. Fall (September–October) is a strong secondary window, summer is the slowest stretch, and winter offers less competition for the right home.
Savannah has a spring market, but the best time to sell depends on the home and buyer pool.
Spring Market: February to May
Spring is usually the most familiar listing window. More buyers are active, curb appeal improves, and families often want to move before the next school year.
Summer Slowdown
Summer can be hot, humid, and travel-heavy. Homes still sell through the summer months, but presentation, pricing discipline, and showing comfort carry more weight when buyer activity slows.
Fall Window: September to October
Fall can be an underrated window. Buyers who paused during summer often return, and relocators may still need to move before year-end.
Winter Advantage
Winter can work for clean, well-priced homes because there may be less competition. Relocation and military-related moves can keep demand active.
Month | Buyer Activity Level | Strategic Notes |
January | Medium | Good for sellers who want less competition. Relocation buyers stay active. |
February | Medium to high | Early spring preparation window. Strong listings get noticed before peak inventory arrives. |
March | High | Strong listing month for prepared homes. Buyer urgency builds toward spring. |
April | High | Often one of the best windows for broad exposure across most segments. |
May | High | Family buyers and relocation buyers remain active. School-year planning drives decisions. |
June | Medium | Heat and travel begin to affect showings. Pricing discipline matters more. |
July | Medium | Vacation season slows casual browsing. Serious buyers continue. |
August | Medium | Back-to-school routines can slow some buyers. Inventory selection often peaks. |
September | Medium to high | Good fall reset window. Buyers who paused during summer return. |
October | Medium | Strong for motivated buyers. Year-end relocation timelines kick in. |
November | Lower to medium | Fewer casual buyers, but serious buyers remain. Less competition for well-priced homes. |
December | Lower | Best for well-priced homes and relocation needs. Limited inventory can favor sellers. |
The right time for any individual seller is the window where the home is genuinely ready, the equity position works, and the neighborhood inventory supports the price. ARC’s Home Value + Selling Plan includes a timing recommendation built around your specific home and goals, not a generic seasonal calendar.
High-ROI Prep Work: What's Worth Doing Before You List
Short answer: The highest-ROI prep work in Savannah is the cleanup-paint-light triad: declutter and deep clean, paint in neutral tones, and update lighting and hardware. Skip major renovations unless your CMA shows a clear payback.
The best prep work removes objections without overbuilding for a buyer you have not met.
Focus first on cleaning, decluttering, yard cleanup, paint touch-ups, lighting, minor repairs, and anything that makes the house feel cared for. Buyers often forgive dated finishes faster than they forgive neglect.
Repairs that matter most include roof concerns, active leaks, HVAC age or performance, electrical safety issues, plumbing problems, crawlspace moisture, wood rot, broken windows, drainage problems, and odor or pet damage.
Staging depends on the home. Full staging may help vacant high-value homes. Occupied staging may be enough for most sellers. Virtual staging can help online presentation, but it should not mislead buyers.
What should you skip? Avoid major renovations unless the math is clear. Do not gut a kitchen, rebuild bathrooms, or choose luxury finishes without a pricing plan. Many Savannah buyers would rather choose their own finishes than pay for a seller’s rushed renovation.
For inherited or deferred-maintenance homes, read ARC’s guide to selling an inherited Savannah home.
Net Proceeds: What You Actually Take Home
Short answer: Your sale price is not your take-home number. Savannah seller net proceeds typically reflect mortgage payoff, agent compensation, closing costs, transfer tax, and any concessions. Expect total seller costs of roughly 7–10% of sale price.
Your sale price is not your take-home number.
A seller’s net proceeds usually reflect mortgage payoff, agent compensation, seller closing costs, transfer tax, prorated property taxes, negotiated concessions, repairs, and any liens or HOA balances. Georgia’s real estate transfer tax is based on sale price at $1 for the first $1,000, plus 10 cents for each additional $100 or fractional part of $100. (Georgia Department of Revenue)
Property taxes also matter. Georgia’s Department of Revenue explains that one mill equals $1 per $1,000 of assessed value, and assessed value is 40% of fair market value in its example calculation. (Georgia Department of Revenue)
Line Item | Typical Range | Example on $500K Sale |
Gross sale price | Final contract price | $500,000 |
Mortgage payoff | Property-specific | Seller payoff required |
Agent compensation | Negotiated | Negotiated amount |
Georgia transfer tax | Based on state formula | About $500 |
Seller closing costs | Varies by contract and title | $1,500 to $4,000+ |
Seller concessions | Market-dependent | $0 to $15,000+ |
Repairs or credits | Inspection-dependent | $0 to $20,000+ |
Prorated taxes / HOA | Timing-dependent | Property-specific |
Estimated net before payoff | Depends on above | Requires property-specific calculation |
A real net sheet is more useful than a headline valuation. ARC’s seller process includes both.
How ARC Builds a Home Value + Selling Plan
Short answer: ARC’s Home Value + Selling Plan combines a real CMA, a neighborhood-specific pricing strategy, prep recommendations, and a net-proceeds estimate, delivered free, with no obligation to list.
ARC’s Home Value + Selling Plan is built for homeowners who want a real number, not a guess.
The process starts with a neighborhood-level comp pull. Then ARC reviews condition, location, likely buyer pool, property strengths, prep needs, pricing range, timeline, and competing inventory. The plan is not built to push you toward listing. It is built to give you a clear view of your options so you can decide on your own timeline.
A good plan answers four questions:
- What is the home likely worth today?
- What could it be worth with smart prep?
- What should you fix, skip, or stage?
- What timeline gives you the best chance of a clean outcome?
Start here: get a free Home Value + Selling Plan.
Frequently Asked Questions
How much is my home worth in Savannah GA?
In April 2026, the median owner-occupied home value is $248,900 in the City of Savannah and $302,700 in Chatham County, per the U.S. Census Bureau (2020–2024). Your specific home’s market value depends on neighborhood, condition, flood zone, parking, and recent comparable sales. A CMA using current MLS data is the most accurate next step.
Is Zillow accurate for Savannah homes?
Zillow can be directionally useful as a starting point, but it often misses Savannah’s block-by-block differences. Historic condition, flood zone, parking, renovation quality, and island insurance profiles can all create valuation gaps of tens of thousands of dollars. Treat the Zestimate as one input, not the final answer.
Are home values in Savannah going up or down?
Broad Savannah-area values were still trending up entering 2026. The FHFA Savannah MSA House Price Index rose from 445.67 in Q4 2024 to 461.88 in Q4 2025. (FRED, Federal Reserve Bank of St. Louis)
What is the median home price in Savannah?
The most recent public benchmarks place the City of Savannah’s median owner-occupied home value at $248,900 for 2020 to 2024, with broader Chatham County at $302,700 (U.S. Census Bureau). The Federal Housing Finance Agency’s Savannah MSA House Price Index continued to rise through Q4 2025, indicating the broader area trend remained positive entering 2026. Current MLS sale prices vary significantly by neighborhood, condition, and price tier. For a current sale-price estimate for your specific home, request ARC’s free Home Value + Selling Plan.
When is the best time to sell a home in Savannah?
Spring is usually the broadest selling window, but fall and winter can also work. The best timing depends on inventory, condition, price point, buyer pool, and your next move.
How much does it cost to sell a home in Savannah?
Seller costs usually include negotiated agent compensation, closing costs, transfer tax, mortgage payoff, prorated taxes, possible concessions, and repair credits. Georgia transfer tax is set by state formula based on sale price. (Georgia Department of Revenue)
How long do homes take to sell in Savannah?
Days on market in Savannah depends on neighborhood, price range, condition, and pricing accuracy. As of April 2026, well-prepared, correctly priced homes in most segments are still going under contract within typical seasonal ranges, while overpriced or under-prepared homes can sit for months. ARC uses trailing 90-day MLS data to estimate DOM for your specific segment.
Should I sell my Savannah home now or wait?
You do not always need an appraisal to estimate market value. A CMA is usually enough for listing strategy, while an appraisal may be needed for lending, estate, divorce, or legal purposes.
Do I need an appraisal to know what my home is worth?
A CMA is an agent-prepared pricing analysis, while an appraisal is a licensed appraiser’s formal valuation. A CMA helps with listing strategy. An appraisal is often used for lending or formal valuation needs.
What's the difference between a CMA and an appraisal?
Redfin’s estimate can be helpful as a starting point, but it can miss local condition, renovation quality, flood exposure, parking, and block-level value differences. Use it as one input, not the final answer.
How accurate is Redfin's estimate for Savannah?
Yes, flood zone can affect Savannah home value because it can affect insurance cost, lender requirements, and buyer confidence. Confirm the exact address through FEMA’s Map Service Center.
Does flood zone affect my home's value in Savannah?
Yes. Flood zone can materially affect Savannah home value because it changes insurance cost, lender requirements, and buyer confidence. Homes in higher-risk zones often face smaller buyer pools and longer days on market. Confirm the exact flood zone for any address through FEMA’s Map Service Center before pricing.
What renovations add the most value in Savannah?
You can request ARC’s free Home Value + Selling Plan through the Sell page. ARC will review recent comps, condition, competition, prep needs, and pricing strategy for your specific home.
How do I get a free home valuation from ARC?
Key Takeaways
- Savannah home values are hyperlocal, especially in historic, island, and waterfront areas.
- Public data is useful for broad context, but MLS data is required for a current neighborhood pricing answer.
- The FHFA Savannah MSA index shows broad price growth entering 2026.
- Zillow and Redfin estimates can miss Savannah-specific value drivers.
- Flood zone, insurance, parking, roof age, condition, and block quality can all move value.
- Sellers should focus on net proceeds, not just list price.
- A human CMA is the best next step if you are deciding whether to sell now or wait.
Want a Real Number for Your Savannah Home, Not a Zestimate?
If you are wondering what your Savannah home is worth, ARC can help you get past the automated estimate and into a real plan.
We will look at your neighborhood, recent comparable sales, condition, improvements, buyer demand, competition, and timeline. Then we will help you understand what your home may be worth today, what prep may improve your outcome, and whether it makes more sense to list now or build a 3 to 6 month plan.
ARC operates without sales pressure or commitment. You leave the conversation with a clearer number, a sharper read on your options, and a path forward that fits your situation.
About the Author
Alex Rodino is the Founder of The ARC Platform (Alexander Rodino Collective), a Savannah and Coastal Georgia real estate practice operating under Keller Williams Coastal Area Partners. Based at 329 Commercial Drive in Savannah, ARC serves homeowners, buyers, and sellers across the Historic District, the islands, and the metro corridors of Pooler, Richmond Hill, and Rincon.
Alex built ARC around a calm, options-first approach. Sellers get neighborhood-specific pricing, practical prep advice, and a clear next-step plan instead of pressure. Buyers get a custom search built around real priorities, not generic filters. For homeowners facing complicated property situations such as inherited homes, deferred maintenance, or time-sensitive sales, Alex provides private guidance with no judgment and no hype.
For a free Home Value + Selling Plan or to start a no-pressure buyer conversation, contact ARC at 912-351-8935 or info@thearcplatform.com.
Sources Cited in This Article
- U.S. Census Bureau, QuickFacts. Median value of owner-occupied housing units (2020–2024). Savannah city, Chatham County, Wilmington Island, Skidaway Island, Pooler, Richmond Hill, Rincon. https://www.census.gov/quickfacts/
- U.S. Federal Housing Finance Agency, All-Transactions House Price Index for Savannah, GA (MSA), Q4 2025 and Q4 2024, retrieved from FRED, Federal Reserve Bank of St. Louis. https://fred.stlouisfed.org/series/ATNHPIUS42340Q
- U.S. Federal Housing Finance Agency, House Price Index methodology and county-level annual index data. https://www.fhfa.gov/data/house-price-index
- Freddie Mac, Primary Mortgage Market Survey, 30-year fixed rate, April 23, 2026, retrieved from FRED. https://fred.stlouisfed.org/series/MORTGAGE30US
- Federal Emergency Management Agency, Map Service Center. https://msc.fema.gov/portal/home
- Georgia Department of Revenue, Real Estate Transfer Tax. https://dor.georgia.gov/real-estate-transfer-tax
- Georgia Department of Revenue, Property Tax Millage Rates. https://dor.georgia.gov/local-government-services/digest-compliance/property-tax-millage-rates

Join The Discussion